

Research﹀
-
Latest Activities NSE International Conference NSE Symposium/Winter Camp
-
Objectives and Actions Working Groups Database Reports & Publications Governance and Partners Events Policy Briefing
Updating Total Assets for the 2020 Fiscal Year to the Database
2022-04-29
In April 2022, the Institute of New Structural Economics (INSE) of Peking University and the French Development Agency (AFD) systematically collected the total assets of PDBs and DFIs for the fiscal year 2020 (FY 2020), with full coverage of publicly available data and rigorous quality control. The latest edition of the database lays out a more comprehensive and up-to-date picture of the size of PDBs and DFIs worldwide. The total assets of PDBs and DFIs in our database have reached USD 22.85 trillion.
The challenges we encountered in the data collection process were mainly due to the unavailability of financial figures for PDBs and DFIs and the heterogeneity of their financial statements. We have followed the same quality control methods used during the first quarter data update to collect publicly available financial data as comprehensively and accurately as possible. We conducted three rounds of quality control, including a cross-checking, a double-checking and final verification by a researcher, a peer senior researcher and co-principal investigators from INSE and AFD respectively. In this news release, we draw the following basic stylized facts based on the information available.
Descriptive statistics about Total Assets
1. Absolute size
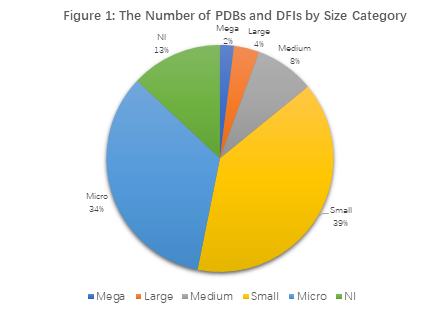
As presented in our flagship research paper, J. Xu et al. (2021) classify PDBs and DFIs into five size categories: mega (more than $500 billion), large (more than $100 billion and less than or equal to $500 billion), medium (more than $20 billion and less than or equal to $100 billion), small (more than $500 million and less than or equal to $20 billion), and micro (less than or equal to $500 million). We use “NI” (i.e. no information) to denote the size category of PDBs and DFIs that have not yet disclosed their total assets.
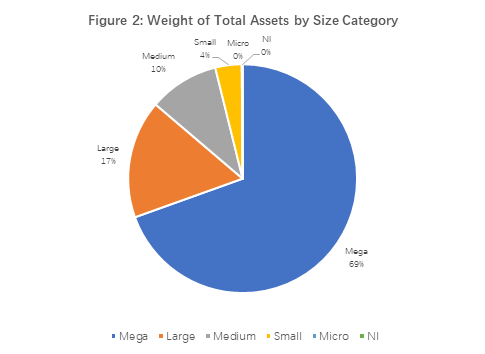
By comparing figure 1 and figure 2, we find that a few mega and large PDBs and DFIs account for a lion’s share of the aggregate total assets. Figure 1 shows that micro, small, and medium institutions make up the majority (81%) in terms of the number of PDBs and DFIs. By contrast, Figure 2 reveals that, a small percentage of mega (2%) and large (4%) PDBs and DFIs possess 86% of aggregate total assets.
2. Relative size
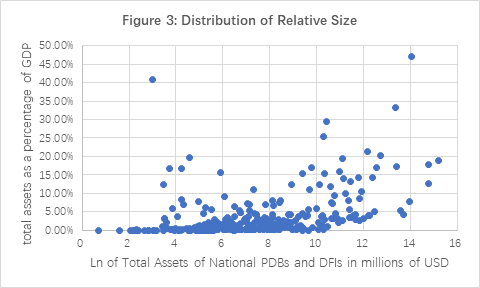
Even though a majority of PDBs and DFIs are small in absolute terms, it does not necessarily mean that they are meagre in relative terms. We use total assets as a percentage of GDP to measure the relative size of PDBs and DFIs. Figure 3 plots the absolute size of 335 national PDBs and DFIs on the horizontal axis in comparison with their relative size on the vertical axis. It shows that some micro and small PDBs and DFIs may carry a relatively greater weight in their home country or economy. For example, the Development Bank of Tuvalu (US$20 million) accounts for an estimated 41% of Tuvalu’s GDP. The Marshall Islands Development Bank (US$41 million) accounts for 17% of the Marshall Islands’ GDP.
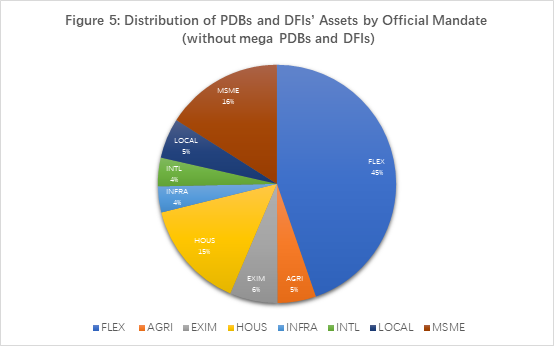
3. Distribution of PDBs and DFIs’ Assets by Official Mandate
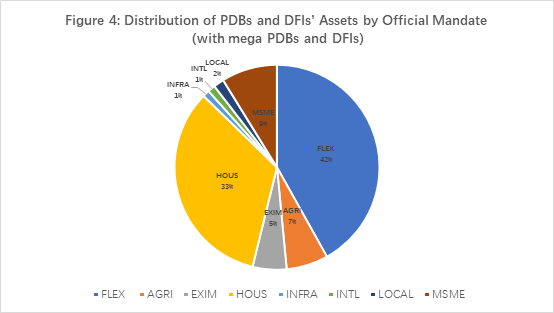
Figure 4 and Figure 5 present the distribution of PDBs and DFIs’ assets by official mandate. Given the preponderant weight of the mega PDBs and DFIs, we set out two scenarios: one includes mega ones, and the other excludes them to analyze the relative weights of PDBs and DFIs’ total assets by mandate. In both scenarios, FLEX (flexible) mandate enjoys the largest assets from PDBs and DFIs, accounting for 42% in the presence of mega PDBs and DFIs and 45% in the absence of mega ones.
In terms of single-mandate PDBs and DFIs, HOUS (social housing) mandate accounts for the largest amount of assets (33%) when mega PDBs and DFIs are analyzed. However, when mega PDBs and DFIs are excluded, the HOUS (social housing) mandate shrinks to 15% in terms of assets. This is largely due to the exclusion of the two giant US DFIs, Fannie Mae (US$3,985,749 million) and Freddie Mac (US$2,627,415 million), ranking first and second on the list of PDBs and DFIs. When mega DFIs and DFIs are excluded, MSME (micro, small, and medium-sized enterprises) becomes the most popular mandate (16%).
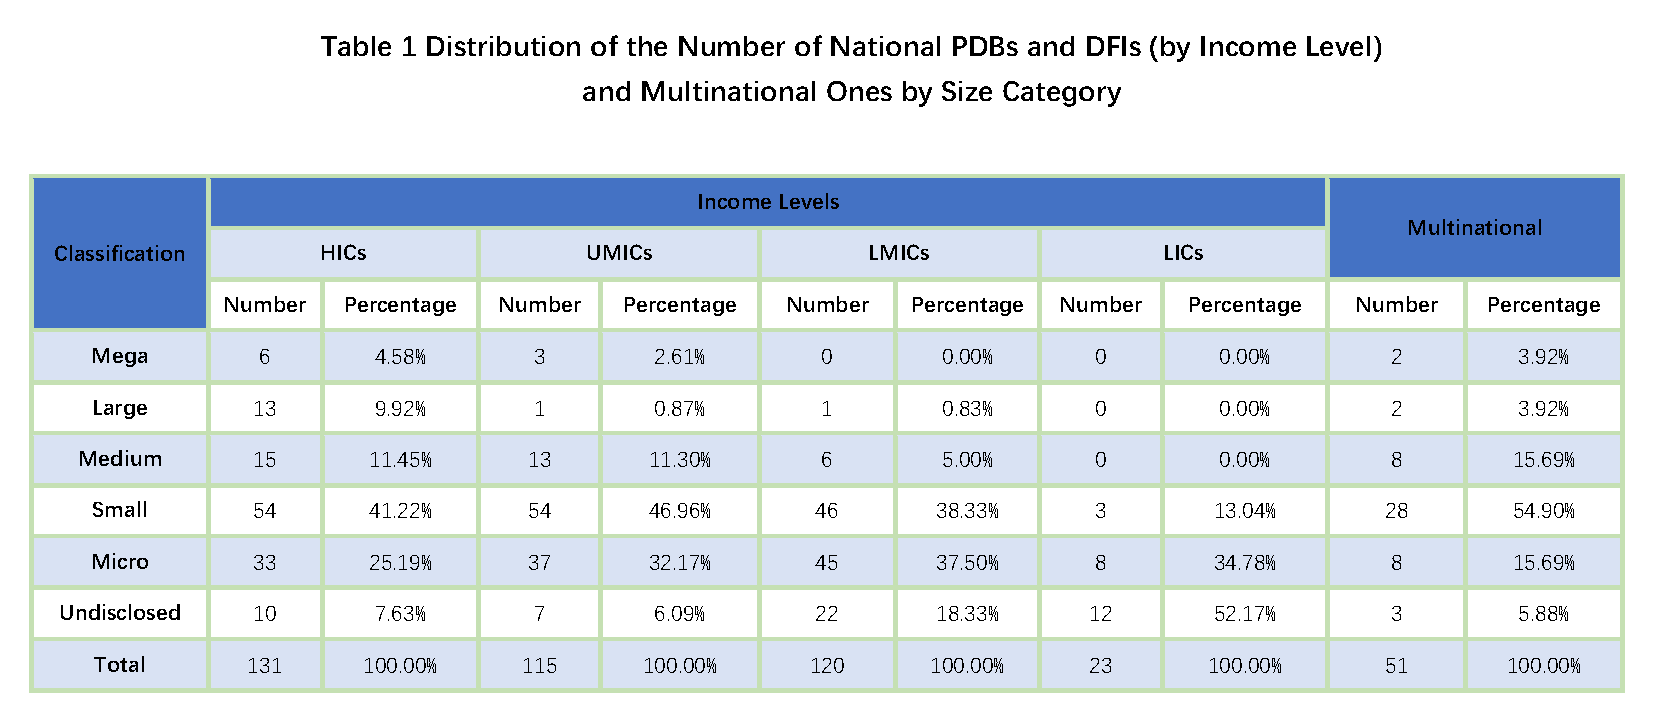
4. Distribution of the Number of National PDBs and DFIs (by Income Level) and Multinational Ones by Size Category
We further analyze the distribution of national PDBs and DFIs by size category across countries with different income levels.
Table 1 shows that all mega national PDBs and DFIs are from HICs and UMICs, while LICs only have small and micro-ones. It also shows that more than half of national PDBs and DFIs from LICs have not yet disclosed their total assets. Given the size of their national economy, they may be more likely to fall into the category of micro or small PDBs and DFIs.
To learn more, please visit our data visualization website (http://www.dfidatabase.pku.edu.cn/) and download the full database for free!
We welcome feedback from academia, policymakers, practitioners from PDBs and DFIs, and other stakeholders to provide constructive suggestions and fill gaps in the database. Please contact us at nsedfi@nsd.pku.edu.cn.
REFERENCES
Xu, Jiajun, Régis Marodon, Xinshun Ru, Xiaomeng Ren, and Xinyue Wu. 2021. “What are Public Development Banks and Development Financing Institutions?——Qualification Criteria, Stylized Facts and Development Trends.”China Economic Quarterly International, volume 1, issue 4: 271-294.