

英文首页﹀
[6.3 Conference] Dani Rodrik: The Recent Growth Boom in Developing Economies: A Structural-Change Perspective
2017-06-15
The Recent Growth Boom in Developing Economies: A Structural-Change Perspective
Dani Rodrik (joint work with Xinshen Diao and Margaret McMillan)

In the last two decades, some countries in Sub-Saharan Africa and Latin America experienced rapid growth. Their experience differs greatly from the standard East Asian path, which is based on rapid industrialization,export oriented industrialization in particular. A question is whether this recent growth around the world is temporary phenomenon, whether it is driven by external environment, or it is lasting.What we’re trying to do is to look at their growth experiencefrom the perspective of structural change, and to see if it is sustainable.
High growth typically can be produced by two forces. One is rapid structural change, i.e. labor movement from low- to high-productivity industries. The other source is within-sector productivity growth.The standard convergence theory, based on the second of these forces, does not produce very rapid growth. It has to be complemented with economic dualism (labor movement from traditional to modern sector) to generate growth miracle.
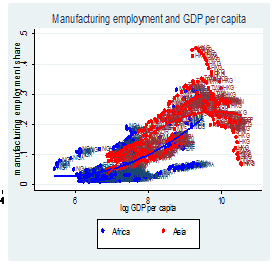
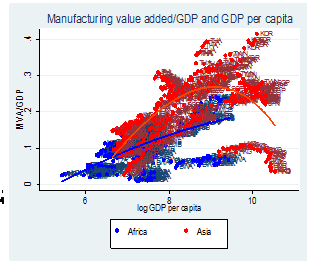
Why does manufacturing play an important role in this process? The first argument is thatempirically we find manufacturing brings unconditional convergence in productivity. In addition, manufacturing products are tradable which means the demand is not constrained. Third, manufacturing has strong labor absorption capacity, particularly low-skilled labor. These three features make manufacturing unique.
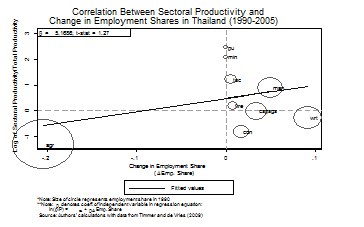
Sectoral productivity and structural change
The following figure shows the relation between sectoralproductivity and structural change in Thailand during 1990 to 2005. The horizontal axis stands for change in employment share, which is a measure of structural change, and the vertical axis stands for sectoral productivity in relation tototal productivity. We observe positivecorrelation between structural change and sectoral productivity. Agriculture has low productivity and shrinks along the time, whilemanufacturing sectors with high productivity expands. Similar pattern can be found in Vietnam, where labor is moving from low productivity to high productivity industries. This is the traditional pattern of economic growth in dualistic economies, which Asian economies have perfected.
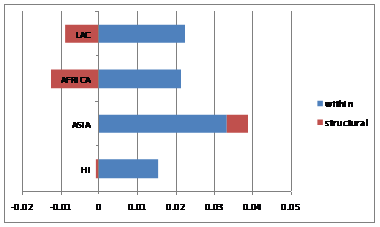
However, if we look at growth experience elsewhere in the world, we find structural change is too often growth-reducing. The following figure shows the results for different areas for the 1990-2005 period. We decompose growth into productivity growth within sectors (the blue bars) and productivity growth due to structural change (the red bars). We can see in Asia, the within-sector and structural change productivity growth are both positive. In Latin America andAfrica, the structural-change component is negative. It indicates that in the latter regions labor is moving from high productivity to low productivity sectors.
In our most recent work, we focused more directly on the recent growth accelerations in Africa and Latin America. We use data from the Penn World Tables (PWT) 9.0 to compute annualized growth rates and toidentify growth accelerations for the Latin American and African countries included in the GGDC’s 10sector database. The results are shown in the following table. Column (1)indicates the year in which the growth acceleration started for each country. Columns (2) and (3) show the average annual growth rates in the pre and post acceleration periods respectively. In column (4) we report the difference between the pre and post acceleration growth rates. In column (5) we indicate whether post-growth output exceeds the pre-episode peak. In column (6), we report the growth rate following the initial seven years of each growth episode. The numbers in column (6) indicate that with the exception of Venezuela countries in Africa and Latin America have continued to grow – mostly at a rapid pace - following the initial period of growth acceleration.
|
Country |
Initial year of growth acceleration(t) |
growth in pre-accel’n period(t-6, t) |
growth in post-accel’n period(t, t+6) |
Differences in pre- & post-accel’n periods |
Whether GDP pc in post-accel’n period >= max in pre-accel’n period |
Growth after 7-years’ growth acceleration (t+6, 2014) |
|
|
(1) |
(2) |
(3) |
(4) |
(5) |
(6) |
|
ETH |
2000 |
1.13 |
3.71 |
2.59 |
Yes |
7.95 |
|
GHA |
1984 |
-5.23 |
2.02 |
7.25 |
Exceeded in 1999 |
2.85 |
|
KEN |
2003 |
-0.34 |
2.08 |
2.42 |
Exceeded in 2004 |
3.04 |
|
MWI |
2002 |
-1.51 |
3.60 |
5.11 |
Exceeded in 2006 |
0.35 |
|
NGA |
2000 |
0.30 |
7.61 |
7.31 |
Yes |
3.21 |
|
SEN |
1995 |
-1.65 |
2.23 |
3.88 |
Exceeded in 1999 |
0.98 |
|
ZAF |
2001 |
0.98 |
3.10 |
2.12 |
Yes |
0.83 |
|
TZA |
1998 |
0.67 |
3.50 |
2.83 |
Yes |
3.13 |
|
ZMB |
2000 |
0.64 |
3.77 |
3.13 |
Yes |
4.60 |
|
IND |
1983 |
1.52 |
3.59 |
2.07 |
Yes |
4.93 |
|
ARG |
1992 |
-0.54 |
2.80 |
3.34 |
Yes |
2.98 |
|
BRA |
2002 |
0.50 |
3.00 |
2.50 |
Yes |
2.90 |
|
CHL |
1988 |
2.66 |
6.25 |
3.59 |
Yes |
3.02 |
|
COL |
2001 |
-0.79 |
3.66 |
4.45 |
Exceeded in 2003/04 |
3.19 |
|
MEX |
1996 |
-0.12 |
2.28 |
2.40 |
Exceeded in 1997/98 |
0.92 |
|
PER |
2002 |
0.76 |
5.47 |
4.71 |
Yes |
4.17 |
|
VEN |
2001 |
-1.11 |
4.20 |
5.31 |
Exceeded in 2005/06 |
-0.18 |
|
BOL |
2003 |
0.34 |
2.93 |
2.59 |
Yes |
3.77 |
|
CRI |
2002 |
2.59 |
4.76 |
2.17 |
Yes |
3.23 |
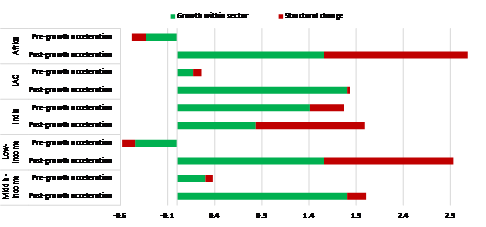
These recent high-growth episodes are anomalous. On one hand, these countries experience rapid structural change. The following figure shows labor productivity growth within sectors and due to structural change, in pre- and post- growth accelerations. The horizontal axis stands for labor productivity growth. The bars are coded according to how much of labor productivity growth comes from structural change (red bars) and how much comes from within sector labor productivity growth (green bars). We can see that for low income countries, a large part of growth comes from structural change, which is good news.
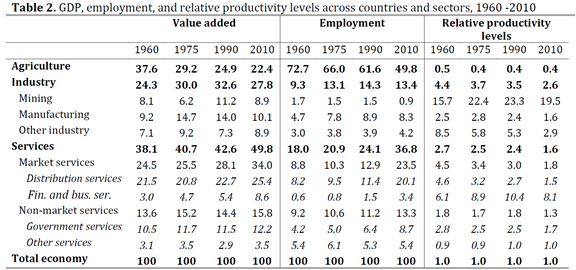
On the other hand, these high-growth episodes take place in the absence of industrialization. The following table shows that manufacturing shares in African countries have been, if anything, declining in recent years, while services expand. In fact, industrialization is lagging behind in Sub-Saharan Africacompared to earlier growth champions, even after controlling for income
Services are different from manufacturing
Why should the earlier move into services be concerning? When you look at services, there are two types. One is high-productivity (tradable) segments of services, such as finance, insurance, business service and IT service, etc. The problem is that these services do not have the ability to absorb as much labor as manufacturing since they are typically skill-intensive. The other type is low productivity (non-tradable) services which can’t act as growth poles. Thatis because they rely on domestic demand and cannot expand without turning their terms of trade against themselves. Continued expansion in one segment relies on expansion on others. There are limited gains from sectoral winners. This produces slow convergence yet again, based on accumulating fundamentals.
Key question and a two-sector Model
Then we have our key question. Where is the rapid structural change coming from in recent high-growth episodes? What does the new model (growth through services) imply for sustainability of growth? We provide a closed-economyframework to illustrate the mechanism. The model relies on the following key assumptions:
- The economy consists of two sectors, modern and traditional
- Two critical assumptions on preferences: preferences are non-homothetic, favoring modern goods; and the demand for modern goods is price elastic.
- Structural misallocation exists, i.e. there is a constant wedge in labor returns between two sectors.
The following figure stands for equilibrium in two-sector economy model with misallocation. The horizontal axis represents the size of the labor force, with the two vertices as the origins of the modern and traditional sectors, respectively. The vertical axes measure the value marginal product of labor in the modern (left axis) and traditional (right axis) sectors The downward sloping schedules capture the declining physical marginal product of labor as employment increases, holding all else constant. The equilibrium allocation of labor is determined such that VMPL